What is Performance Monitor?
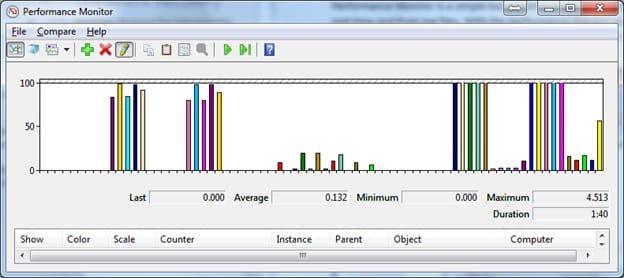
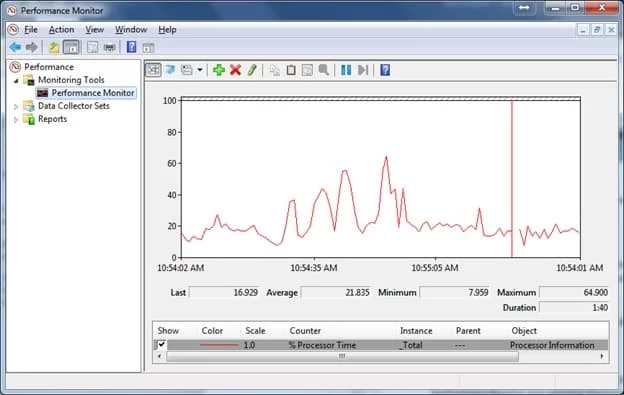
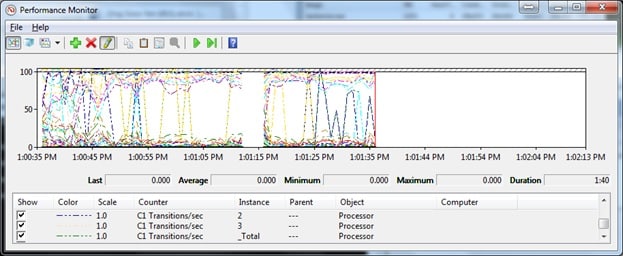
Performance Monitor is a simple but powerful visualization tool for viewing performance data, both in real time and from log files. With the performance monitor you can view and examine the performance data in a graph, histogram, or report. This is very useful when troubleshooting if a pc is slow, or if a program hangs or crashes a lot.
To start Performance Monitor
- Click Start, click in the Search box and type perfmon , and press ENTER.
- In Programs, click perfmon.exe.

You may also use this command to use the Performance Monitor more efficiently.
perfmon /rel:
This lets you review your computer’s reliability and problem history. This is also the tool that we normally used for trouble shooting. It can show which program has been crashing or hanging recently and what is causing it.

perfmon /report:
This collects performance data for 60 seconds and then generates and displays a system diagnostics report.
perfmon /res:
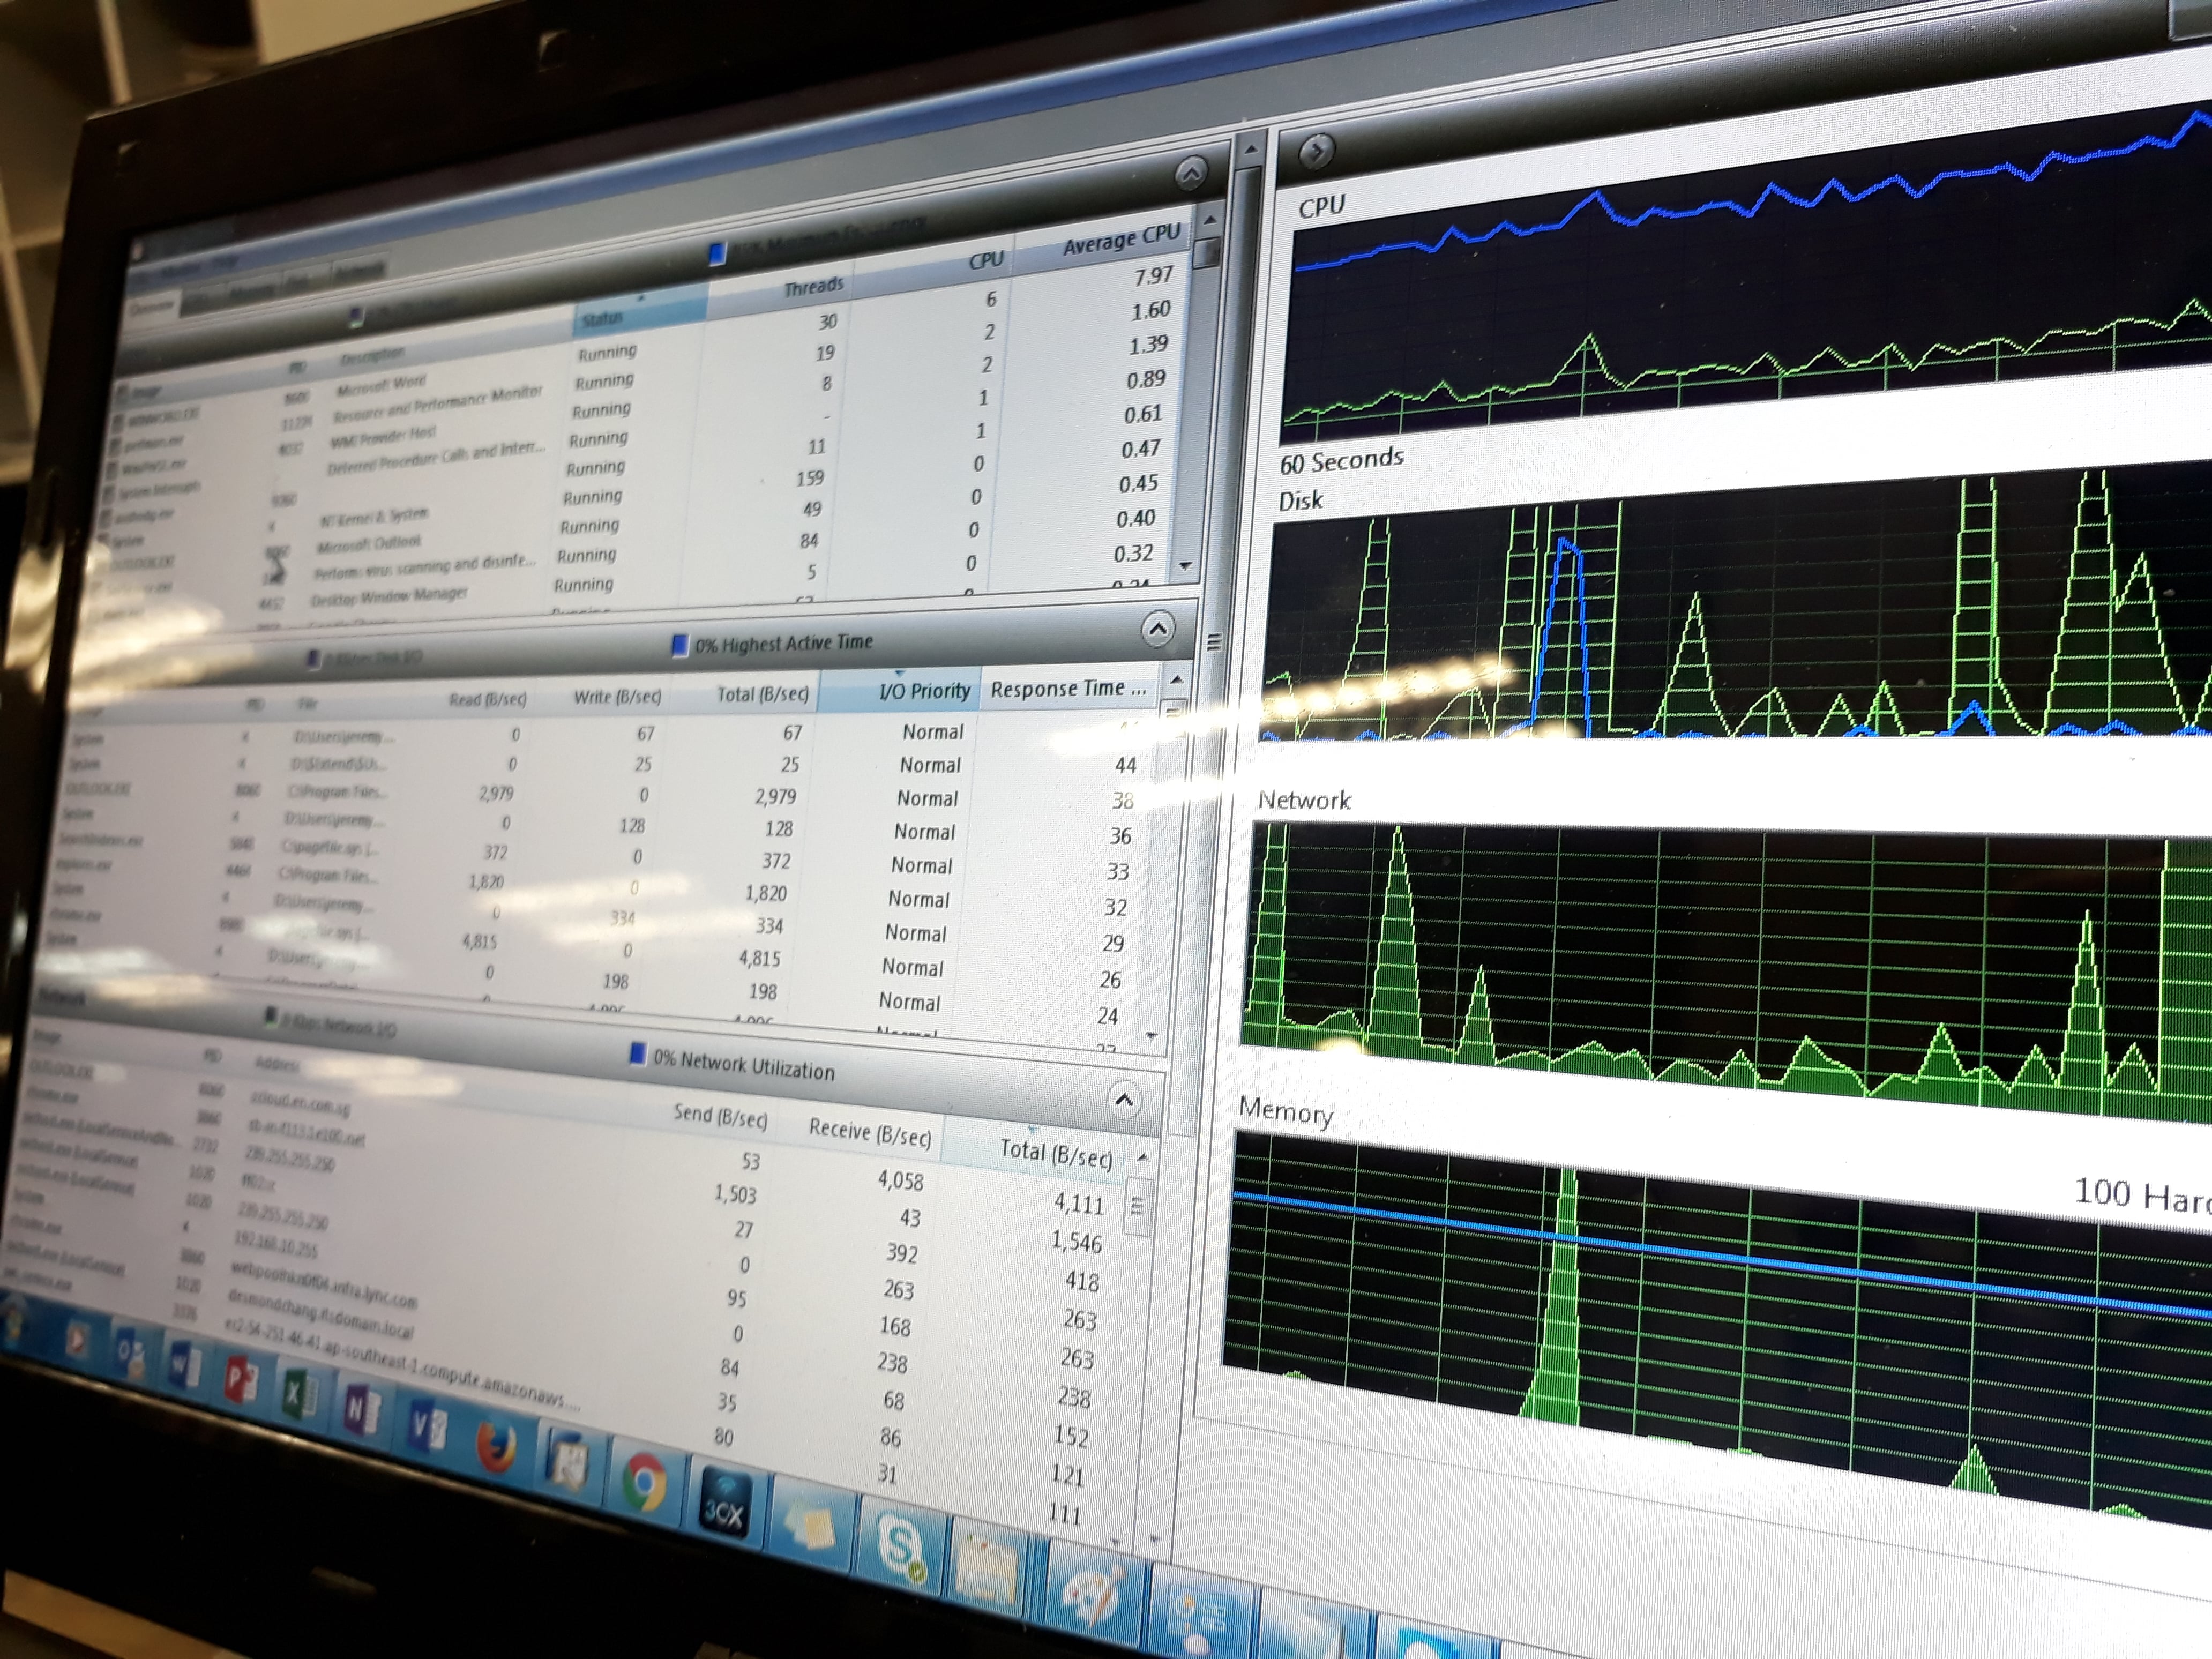
Opens the Resource Monitor (the same result as right-clicking the Monitoring Tools node in Performance Monitor and selecting Resource Monitor).

perfmon /sys:
Opens the Performance Monitor in stand-alone mode (the Sysmon.ocx ActiveX control).
perfmon /comp:
This allows for comparison overlay between two open instances of Performance Monitor.